Guides
Monitoring and Alerting
Enable Prometheus, Alertmanager, Grafana, and node-exporter.
Monitoring architecture
| Component | Purpose | Deployment method |
|---|---|---|
| Prometheus | Collects and stores OpenIMServer time-series metrics | Enabled manually via profile |
| Alertmanager | Deduplicates, groups, and routes operational alerts | Enabled manually via profile |
| Grafana | Visualizes metrics through customizable dashboards | Enabled manually via profile |
| node-exporter | Collects host-level system metrics (CPU, RAM, disk, network) | Enabled manually via profile |
Start the monitoring stack
Start containers with Docker Compose
OpenIMServer uses Prometheus, Alertmanager, Grafana, and node-exporter for infrastructure and application observability. Standard docker compose up -d invocations do not start these services by default. Explicitly enable the m (monitoring) profile:
docker compose --profile m up -dWindows deployments: This Compose profile relies on host networking suitable for Linux. When running under Windows Docker Desktop, adjust the network mode and port forwarding indocker-compose.yml, and replace127.0.0.1scrape targets inprometheus.ymlwith your host machine's LAN IP address.
Import OpenIMServer dashboards into Grafana
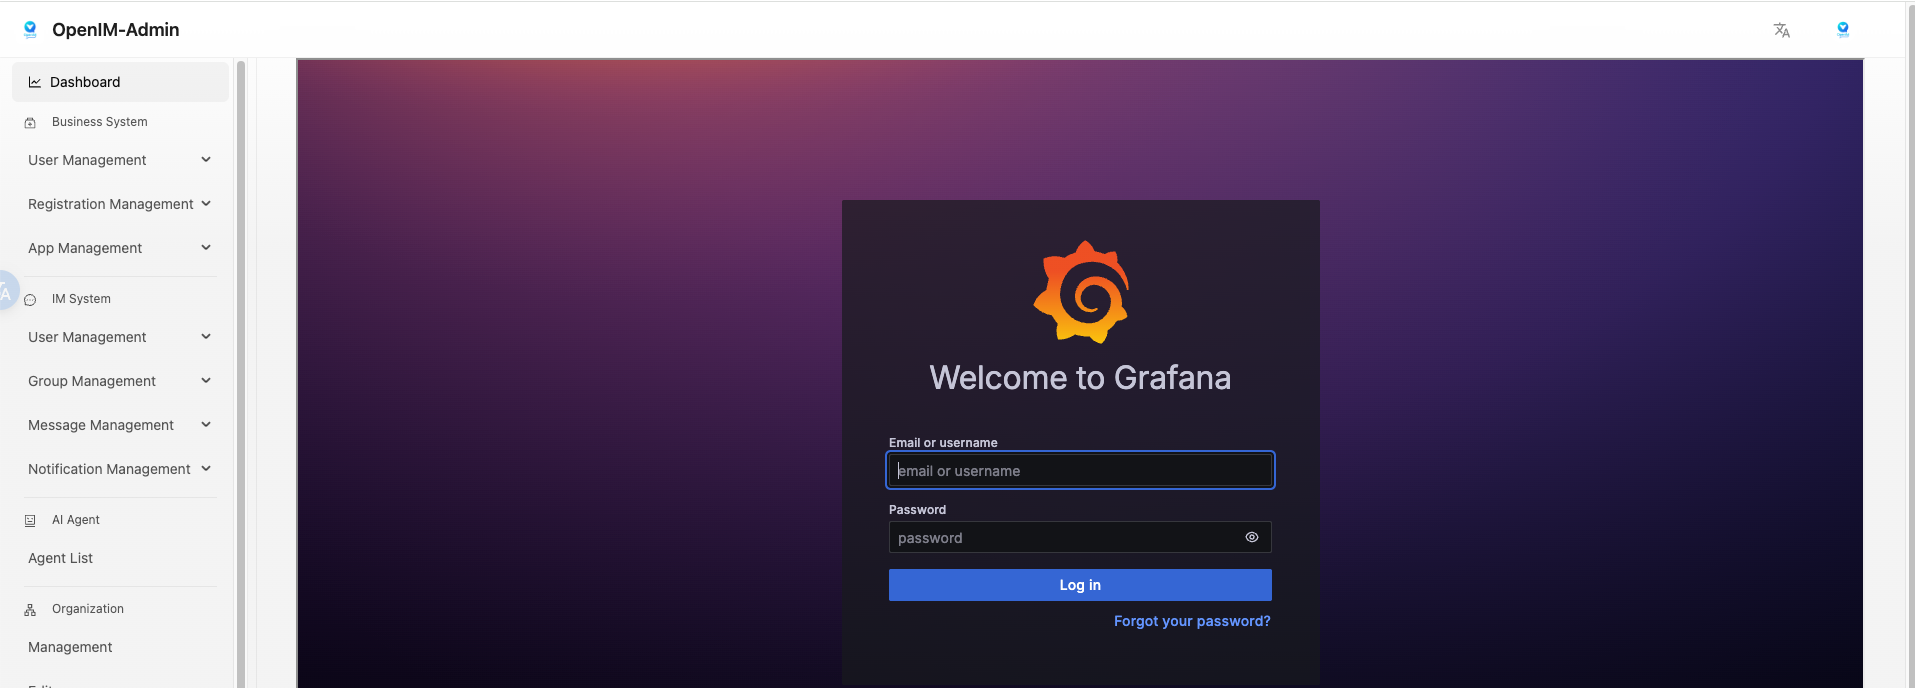
Sign in to Grafana
- Log in to the OpenIM Admin Console, then select Data Monitoring in the left sidebar.
- Sign in to Grafana using the default credentials (
admin/admin). - Alternatively, navigate directly to
http://your_ip:13000in your browser (replaceyour_ipwith your server host IP).
Add Prometheus as a data source
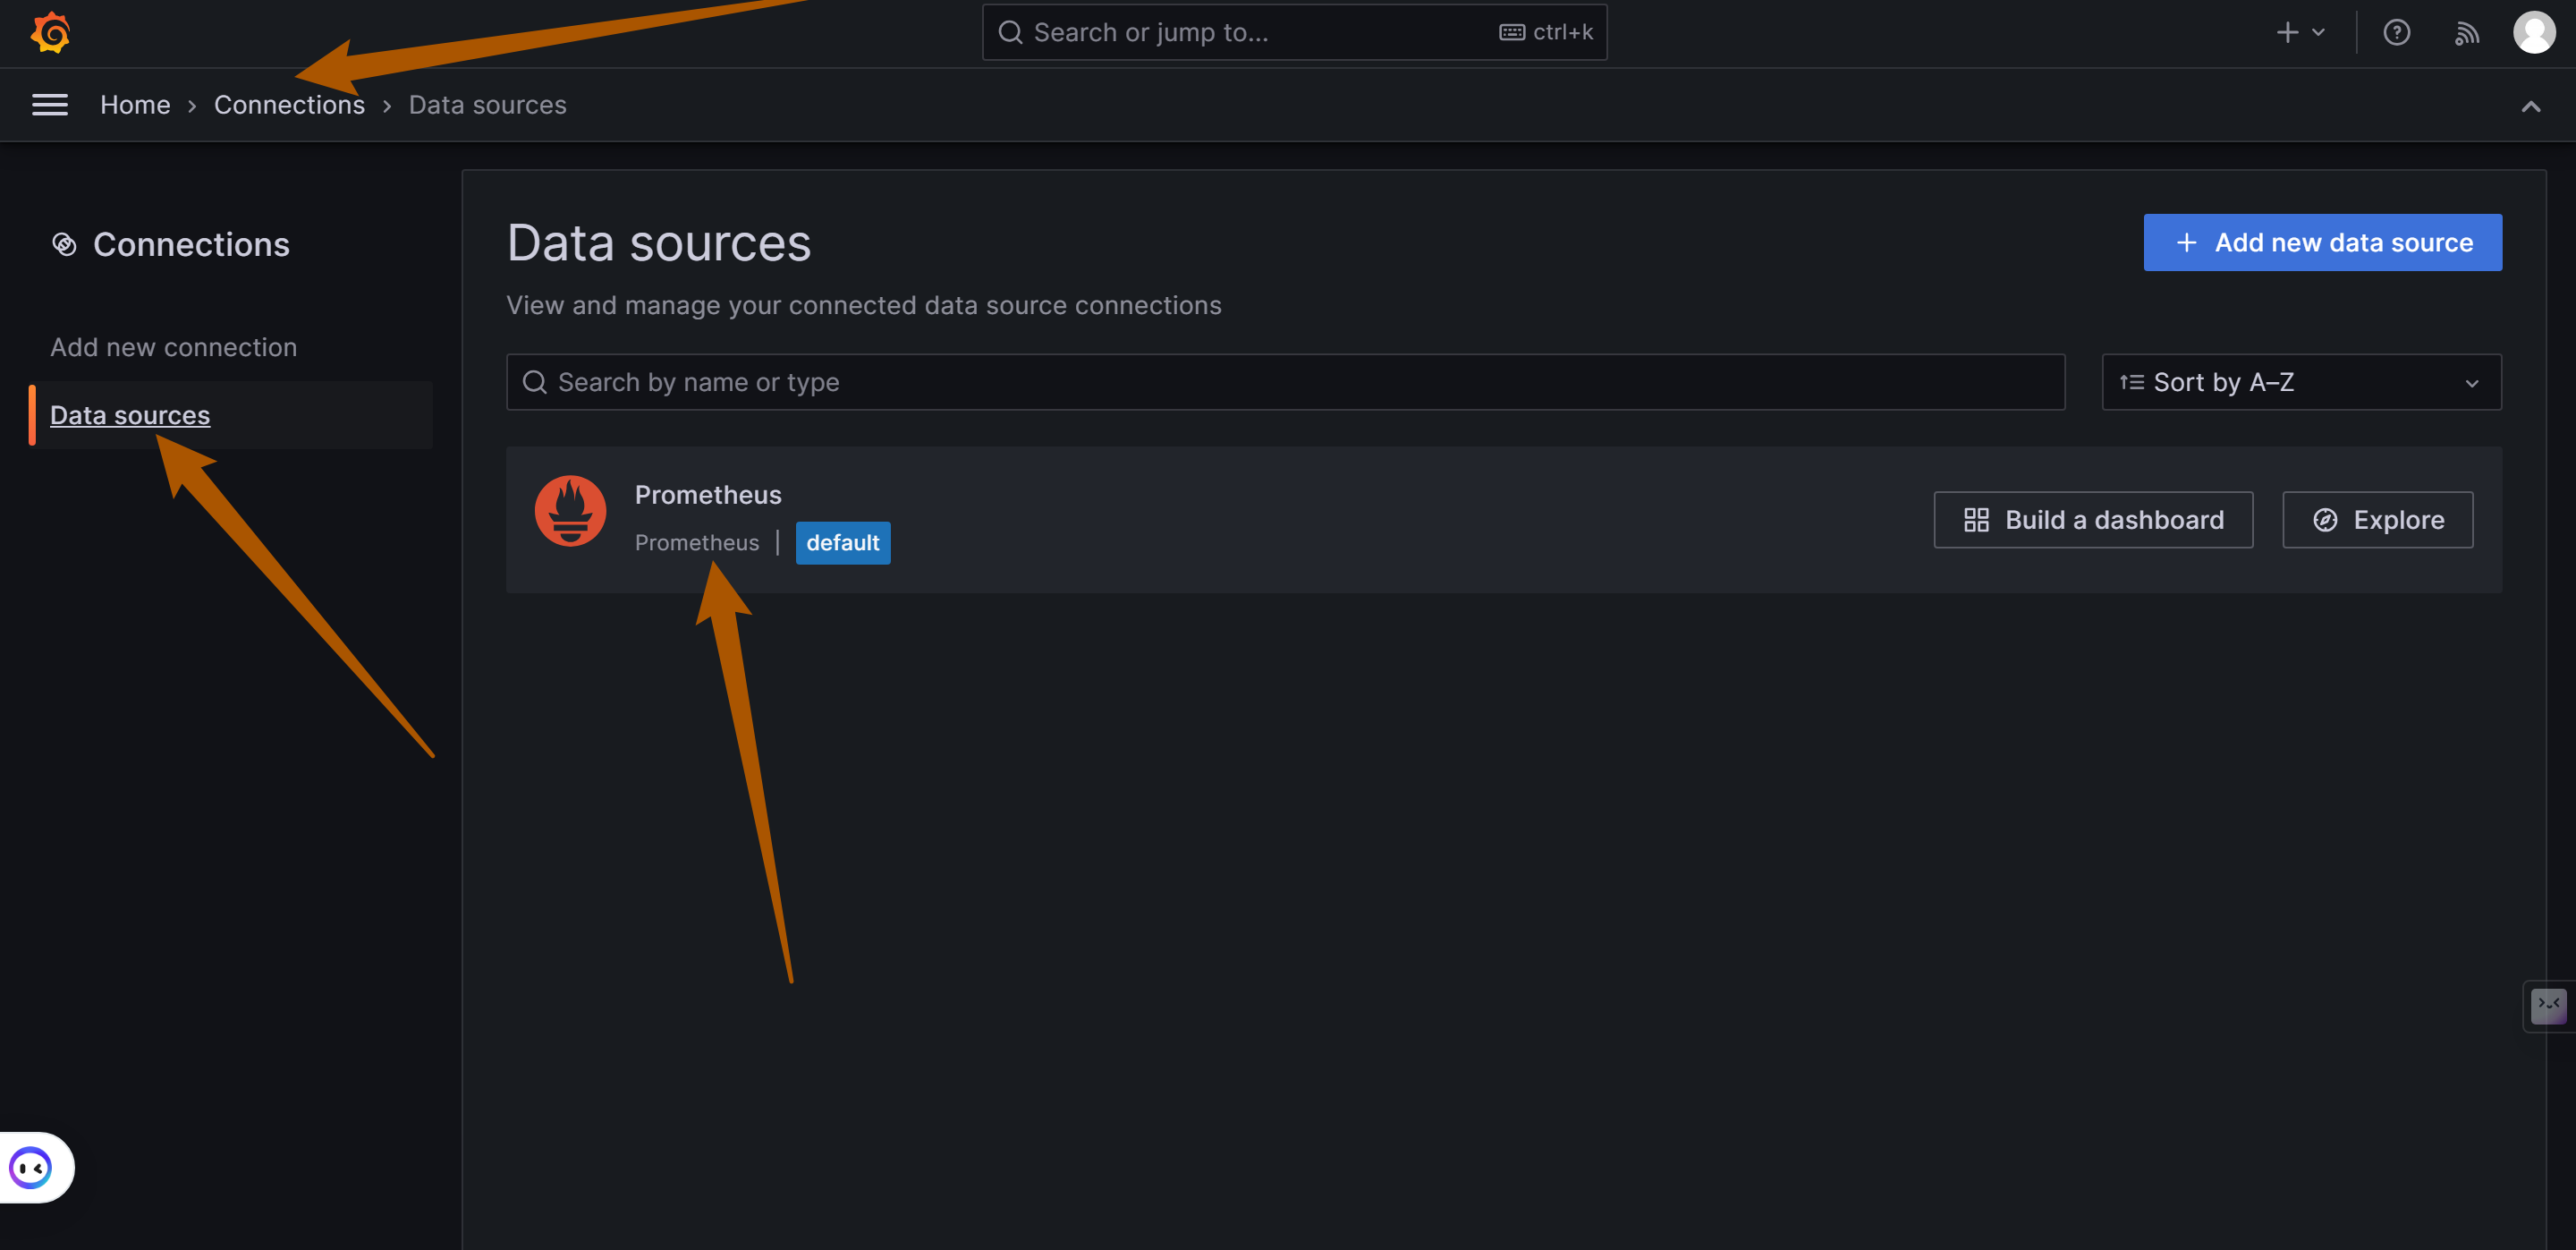
- In the Grafana left navigation menu, open Connections > Add new connection.
- Search for Prometheus and select it.
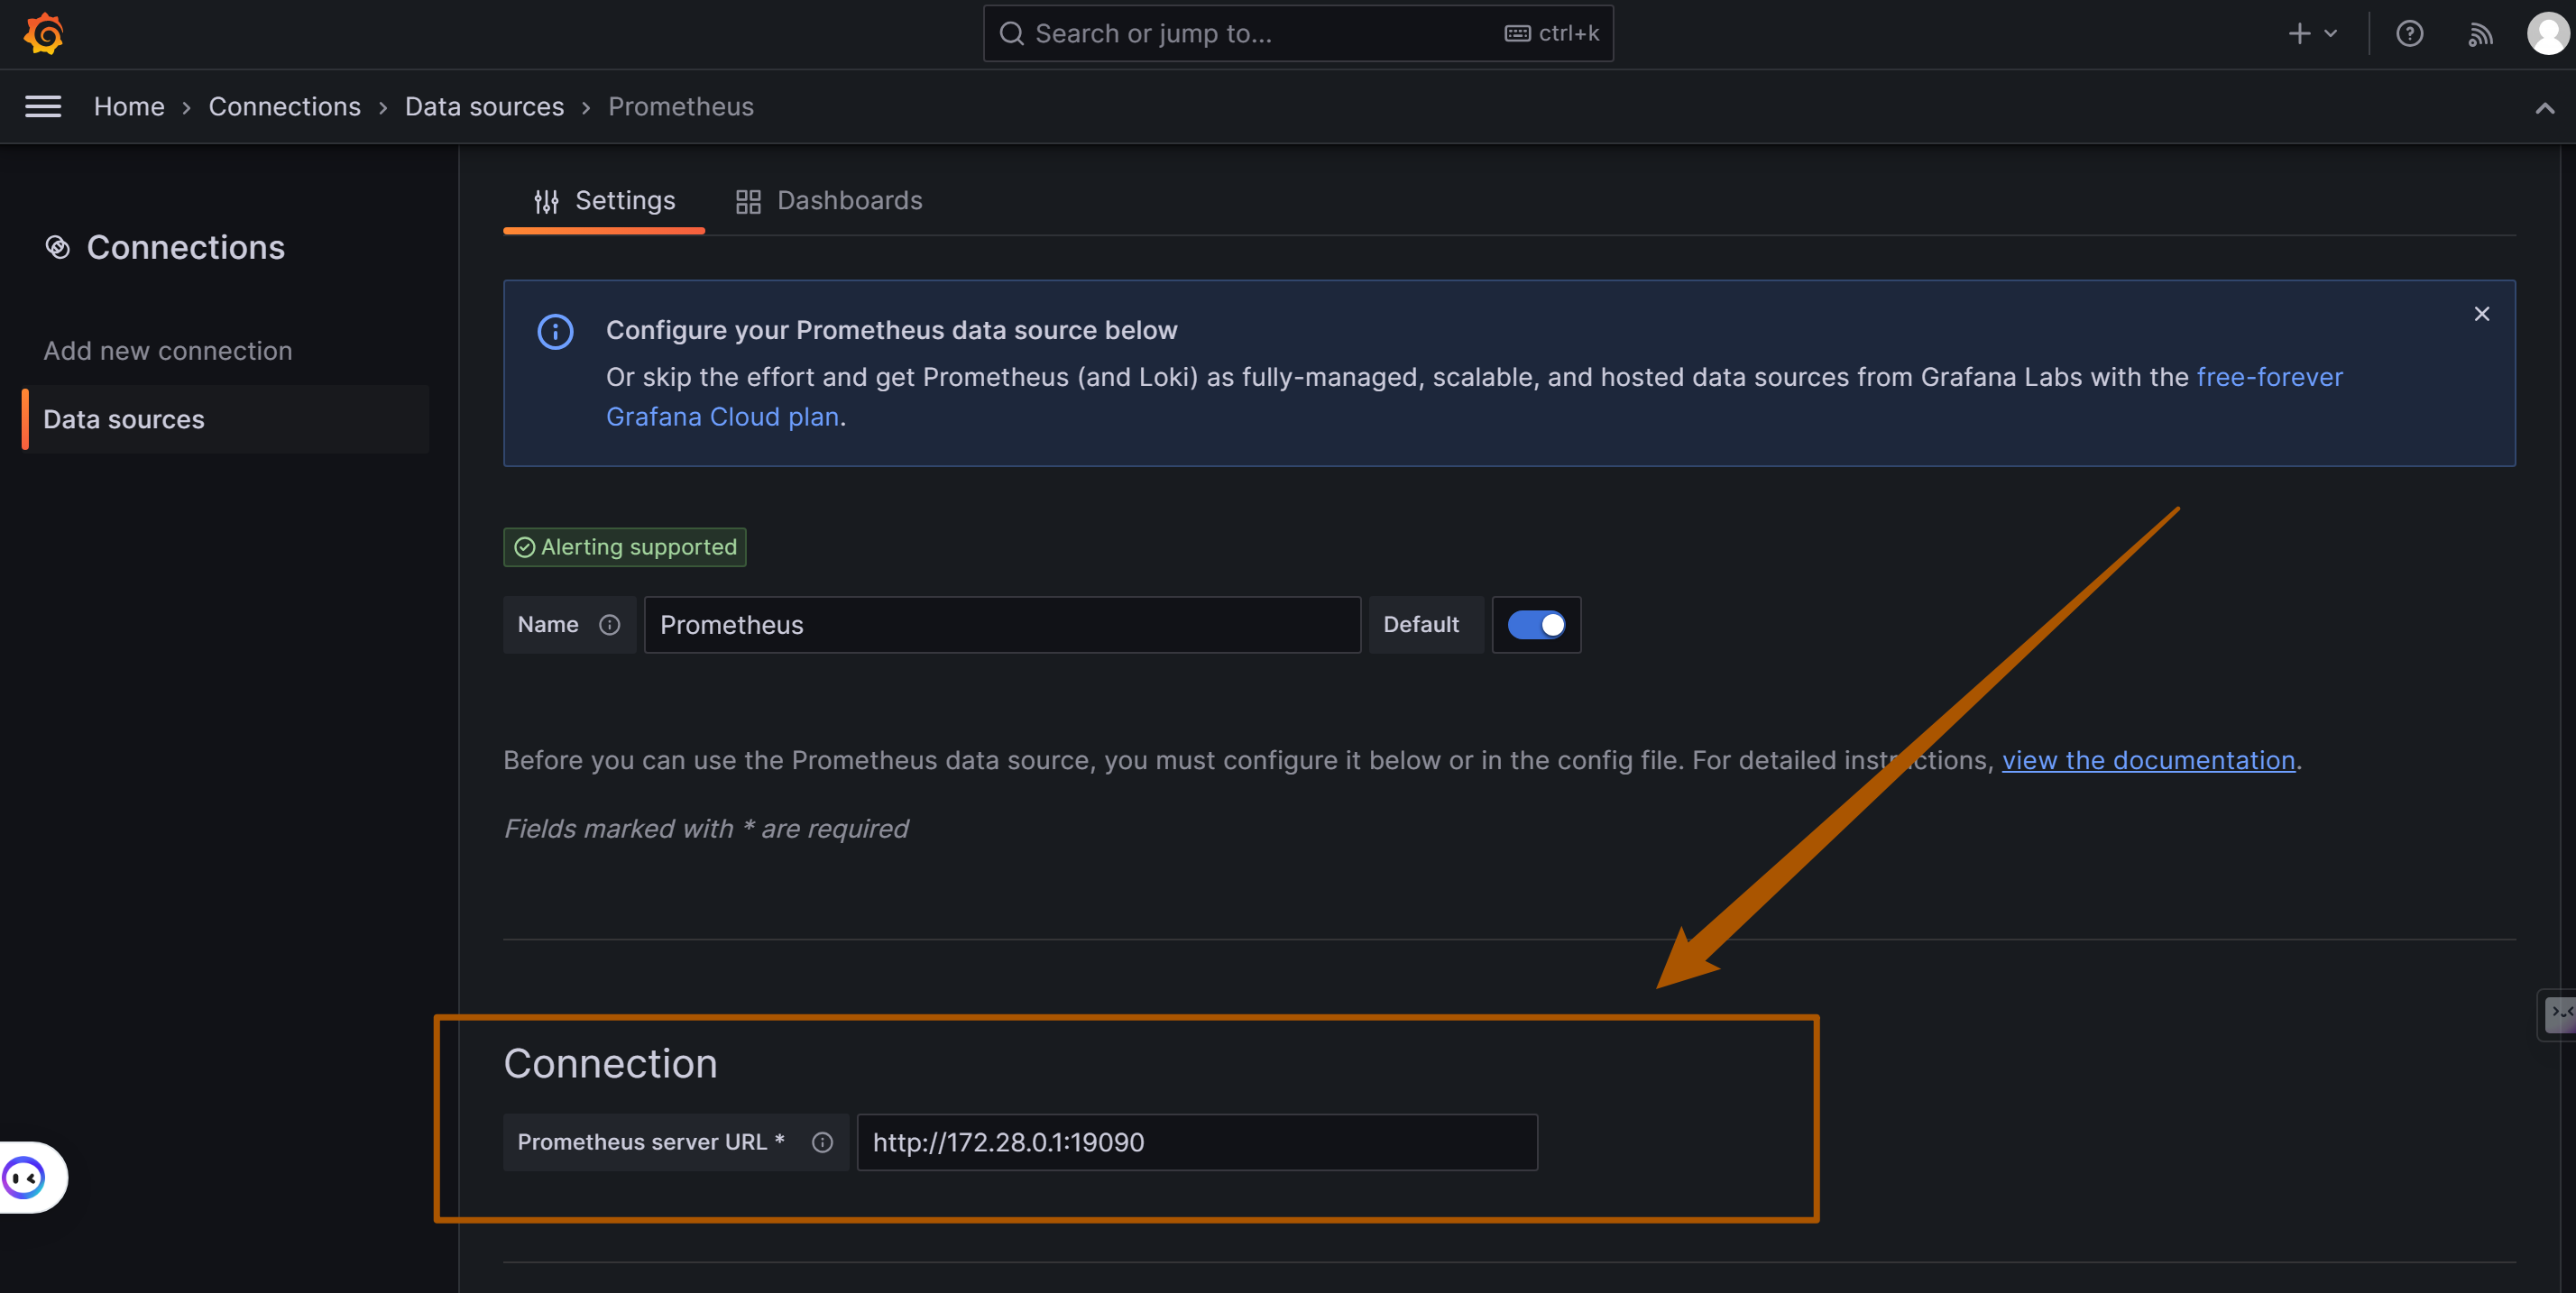
- In the Prometheus server URL field, enter
http://your_ip:19090(where19090is the Prometheus default port). - Click Save & test to confirm connectivity.
Import the OpenIMServer dashboard
- Navigate to Dashboards, click New, and select Import.
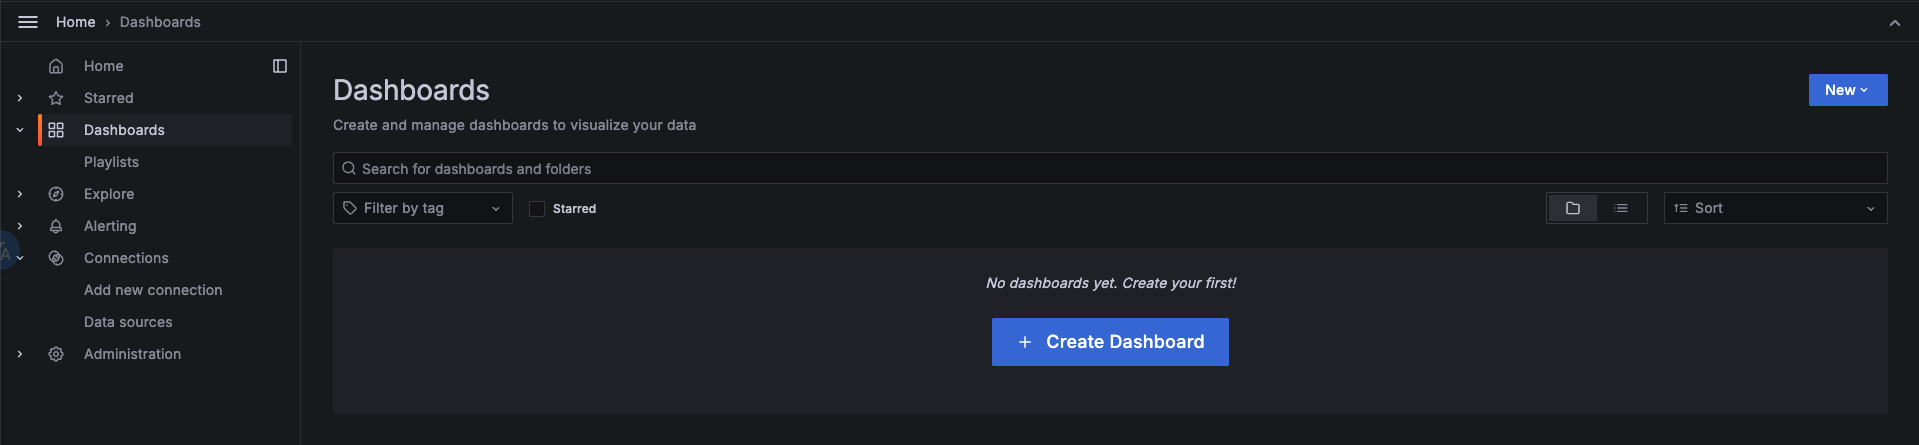
- Import the OpenIMServer dashboard using either method:
- Copy the raw JSON from Demo.json and paste it into Import via dashboard JSON model.
- Click Upload dashboard JSON file and select
open-im-server/config/grafana-template/Demo.json. - Click Load.
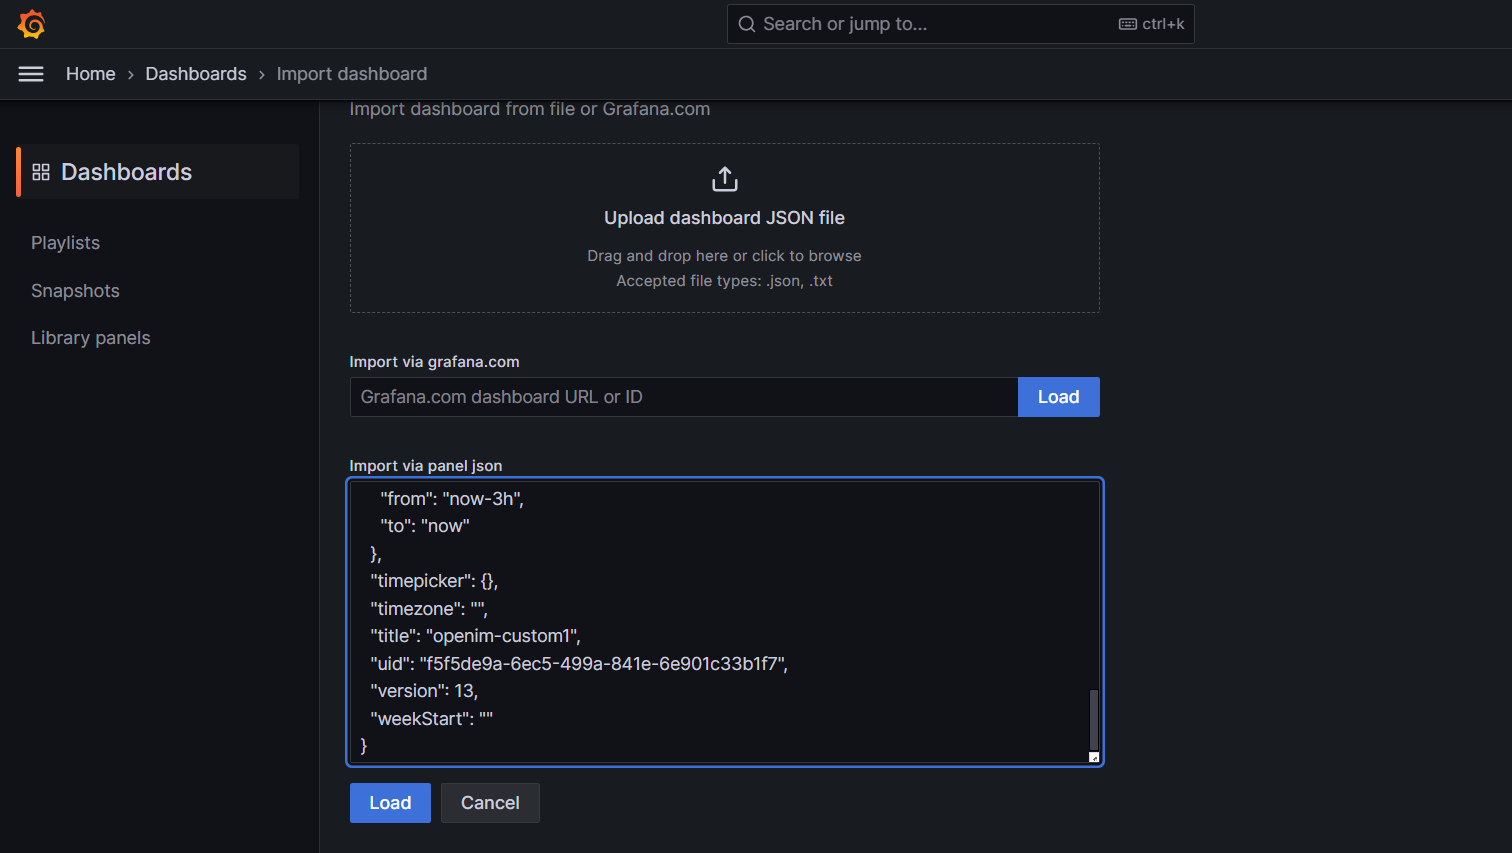
- Select the Prometheus data source created in the previous step, then click Import.
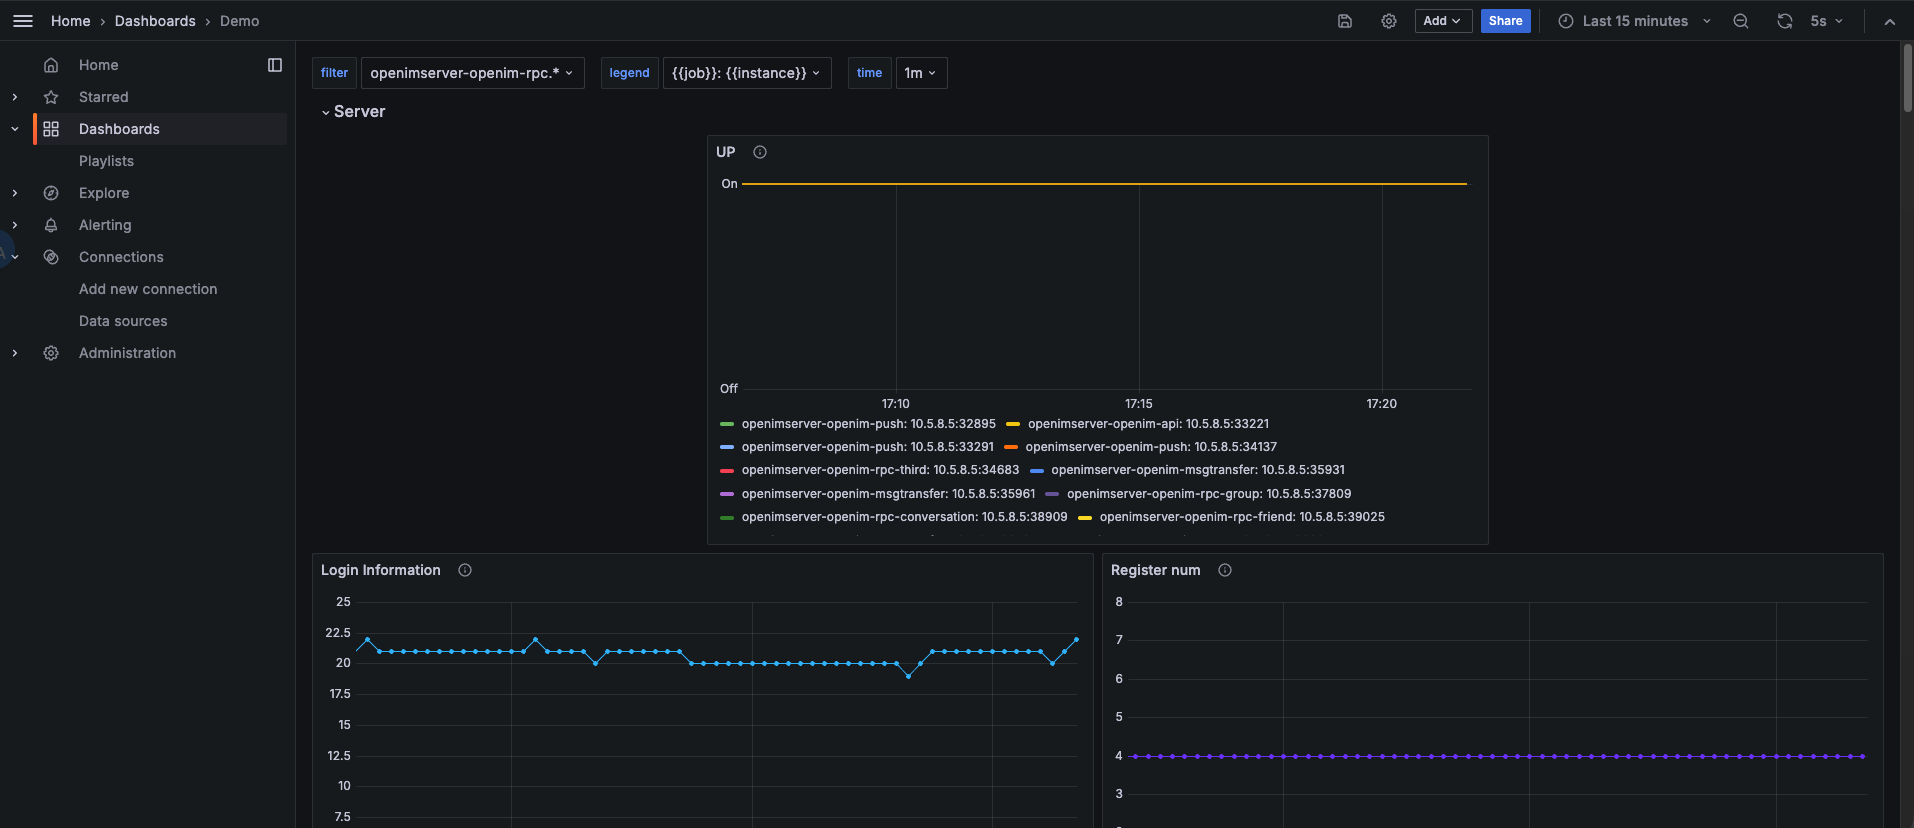
OpenIMServer core performance metrics and service statuses are now visualized.
Import node-exporter host metrics
- Open Dashboards, click New, and select Import.

- Enter dashboard ID
1860into Grafana.com dashboard URL or ID, then click Load. - Select your Prometheus data source and click Import.
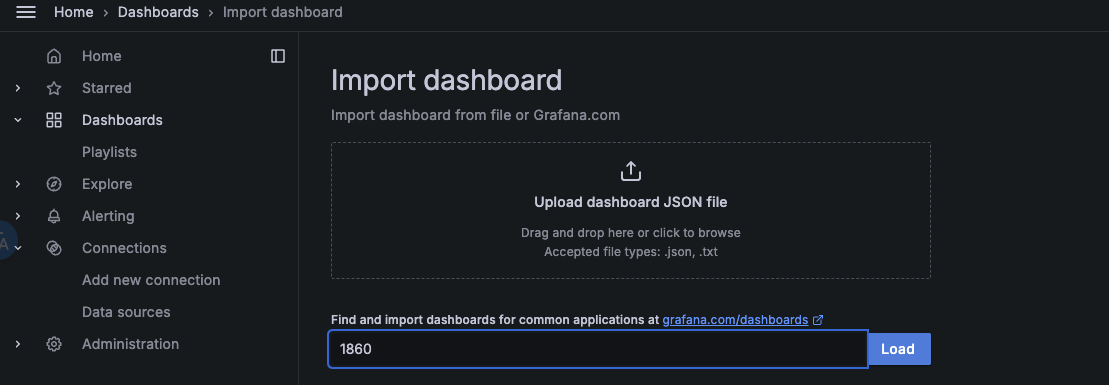
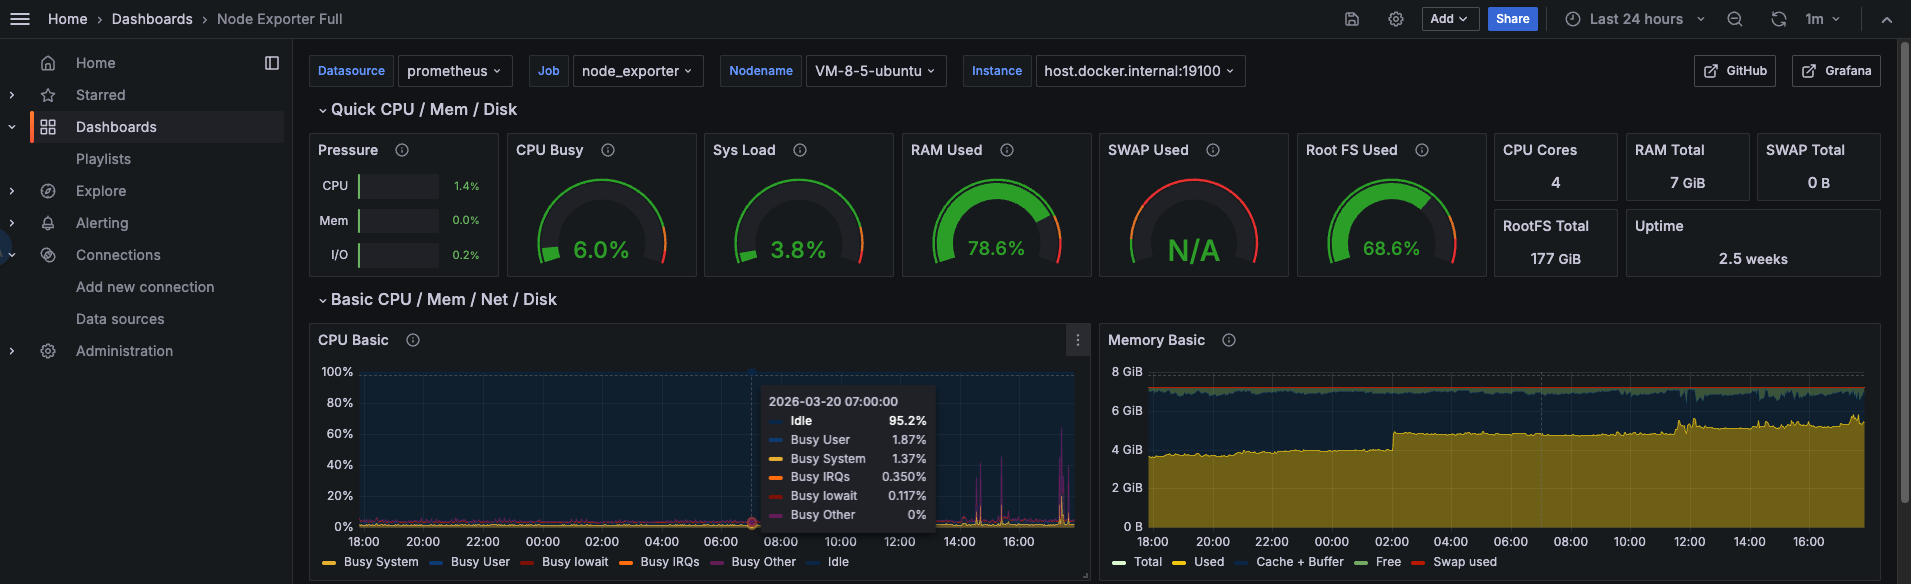
Once imported, host-level metrics including CPU utilization, memory pressure, disk I/O, and network throughput are displayed: