运维系统
组件说明
| 组件名称 | 组件说明 | 部署说明 |
|---|---|---|
| prometheus | 用于收集和存储指标数据的监控系统组件 | 需手动启用 |
| alertmanager | 管理和发送告警的组件 | 需手动启用 |
| grafana | 用于展示监控数据的仪表板组件 | 需手动启用 |
| node-exporter | 用于采集节点(如服务器)指标信息 | 需手动启用 |
启动监控
1.启动组件
目前OpenIM使用的监控告警组件为prometheus、alertmanager、grafana、node_exporter。在使用docker compose up -d启动组件时,默认不会启动监控组件。如需启动监控组件,需要使用命令为:
docker compose --profile m up -d
注意:以上方式不适用于windows系统。如果需要在windows系统中启用监控组件,需要自行修改docker-compose.yml中监控组件的网络模式,并映射相应的端口,最后将prometheus.yml中的
127.0.0.1替换为内网ip地址。
2.Grafana导入OpenIM主要指标数据
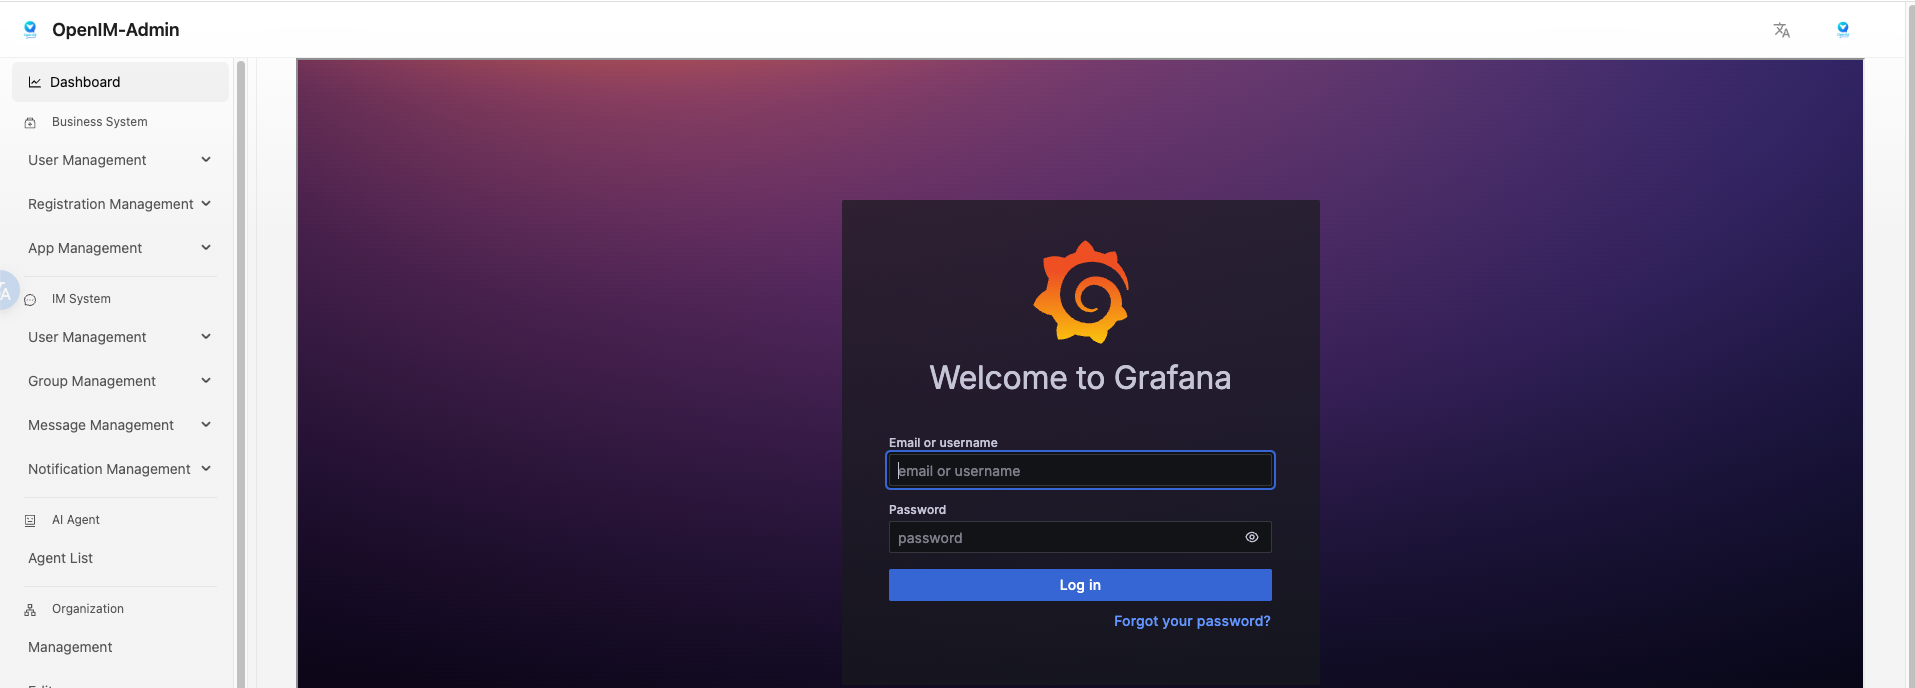
登录grafana
先登录管理后台,再点击左侧数据监控菜单,输入默认用户名(admin)和密码(admin)登入grafana.
也可以直接访问your_ip:13000进行访问,将youre_ip改为部署机器的ip地址。
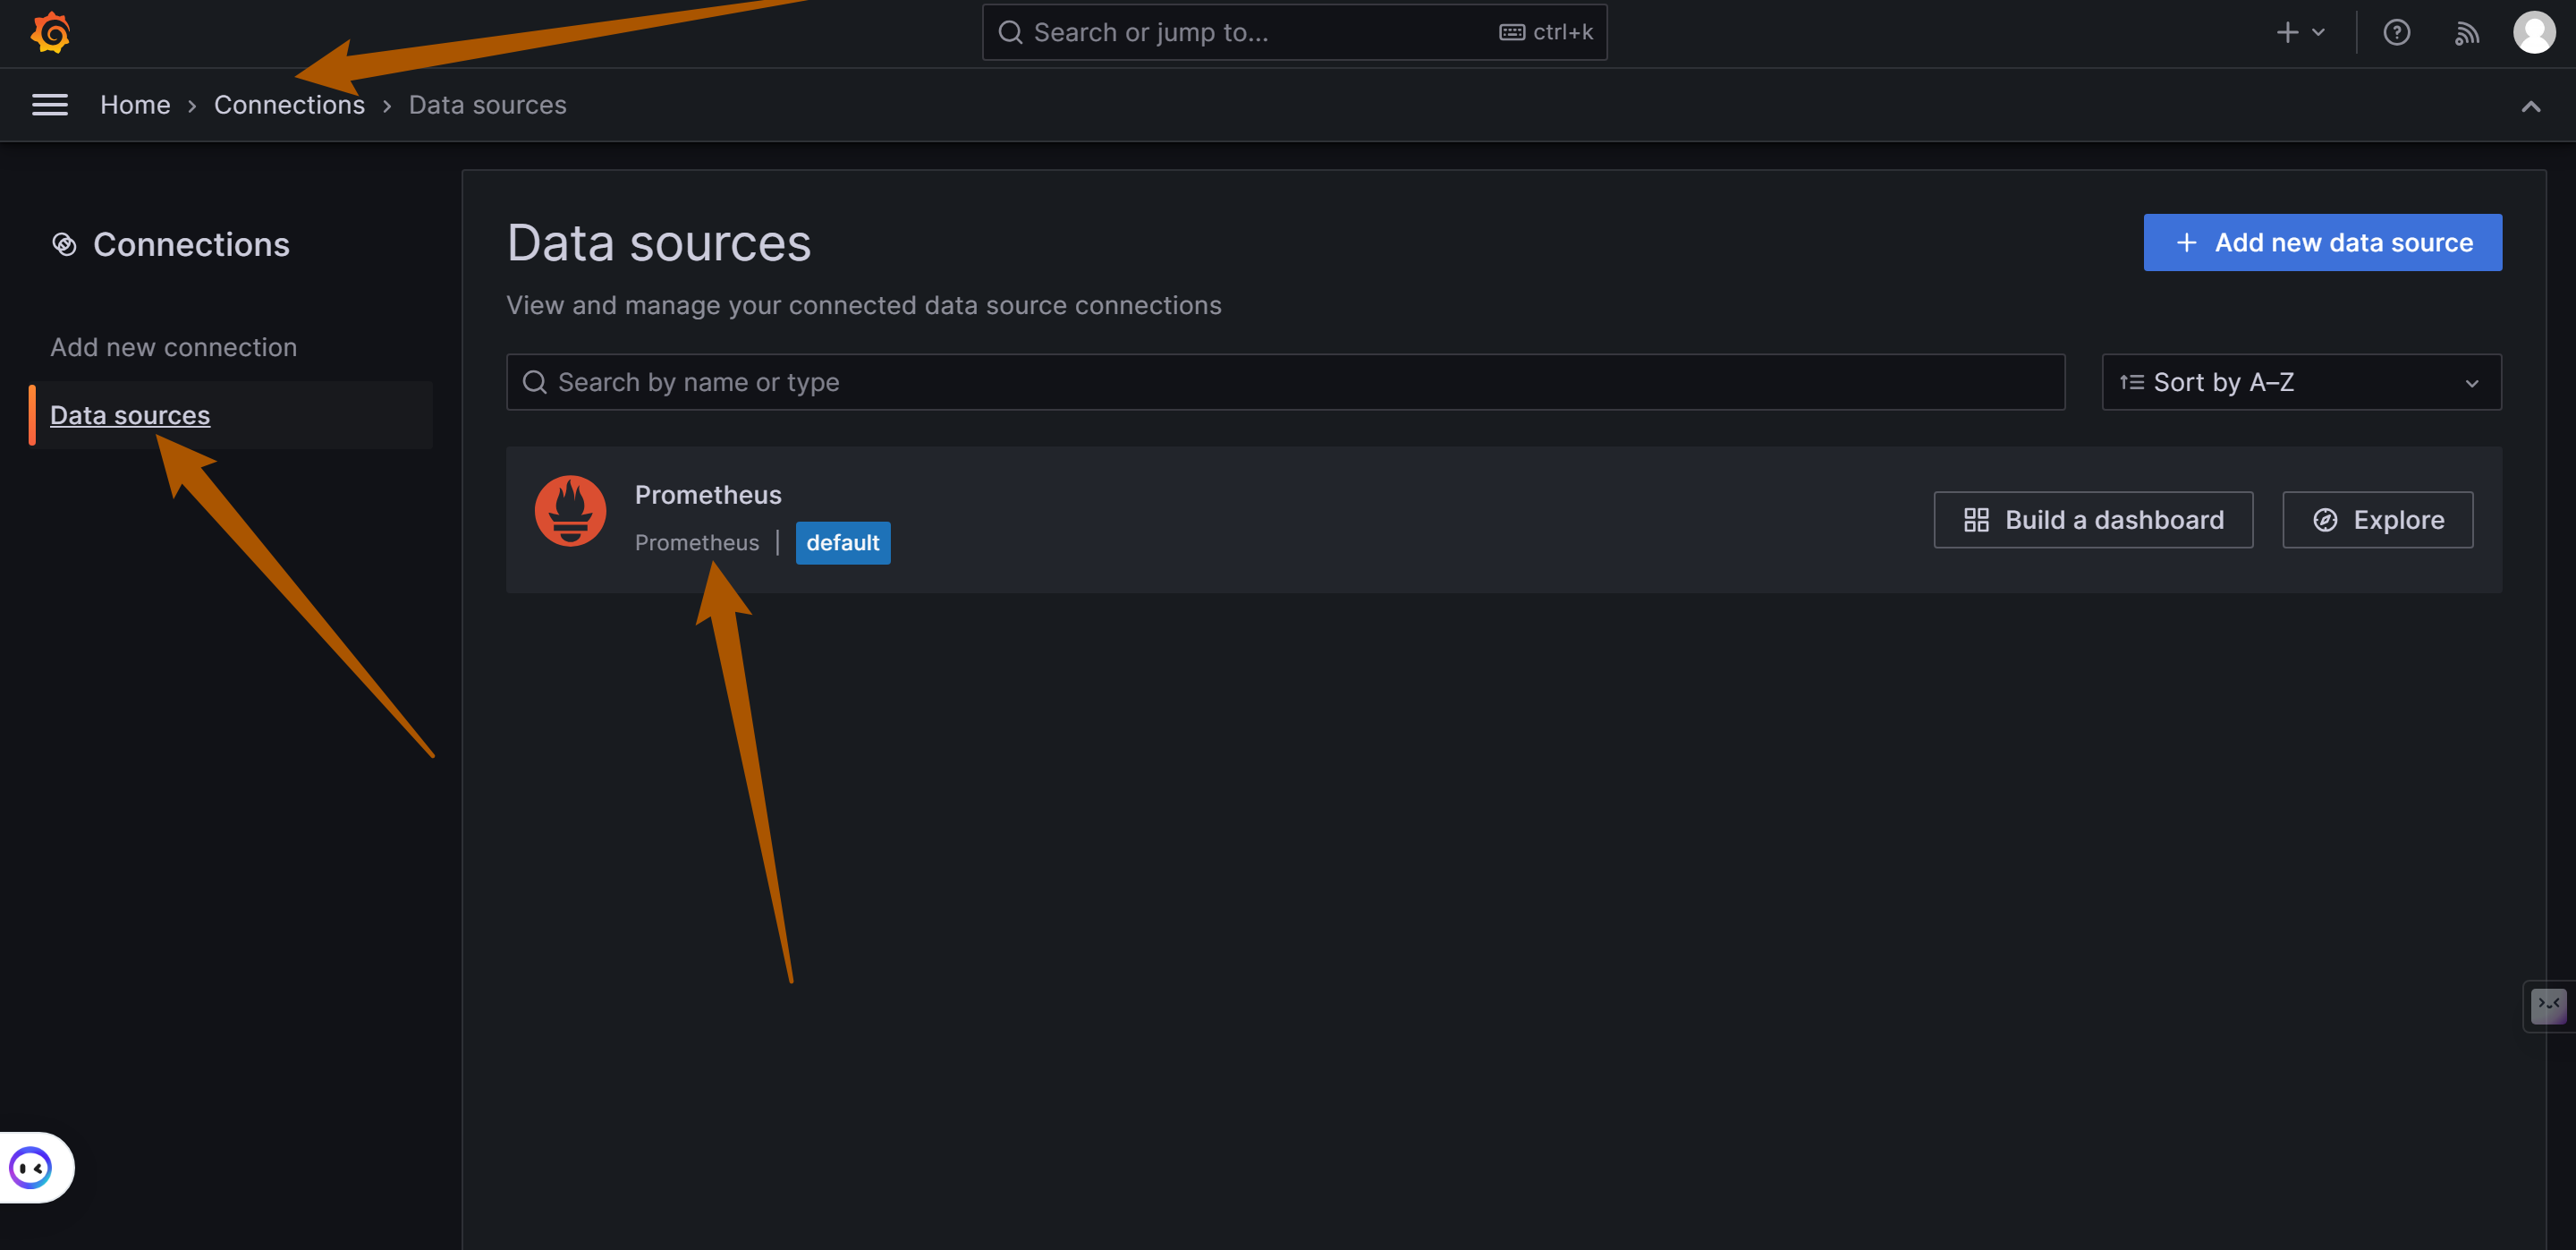
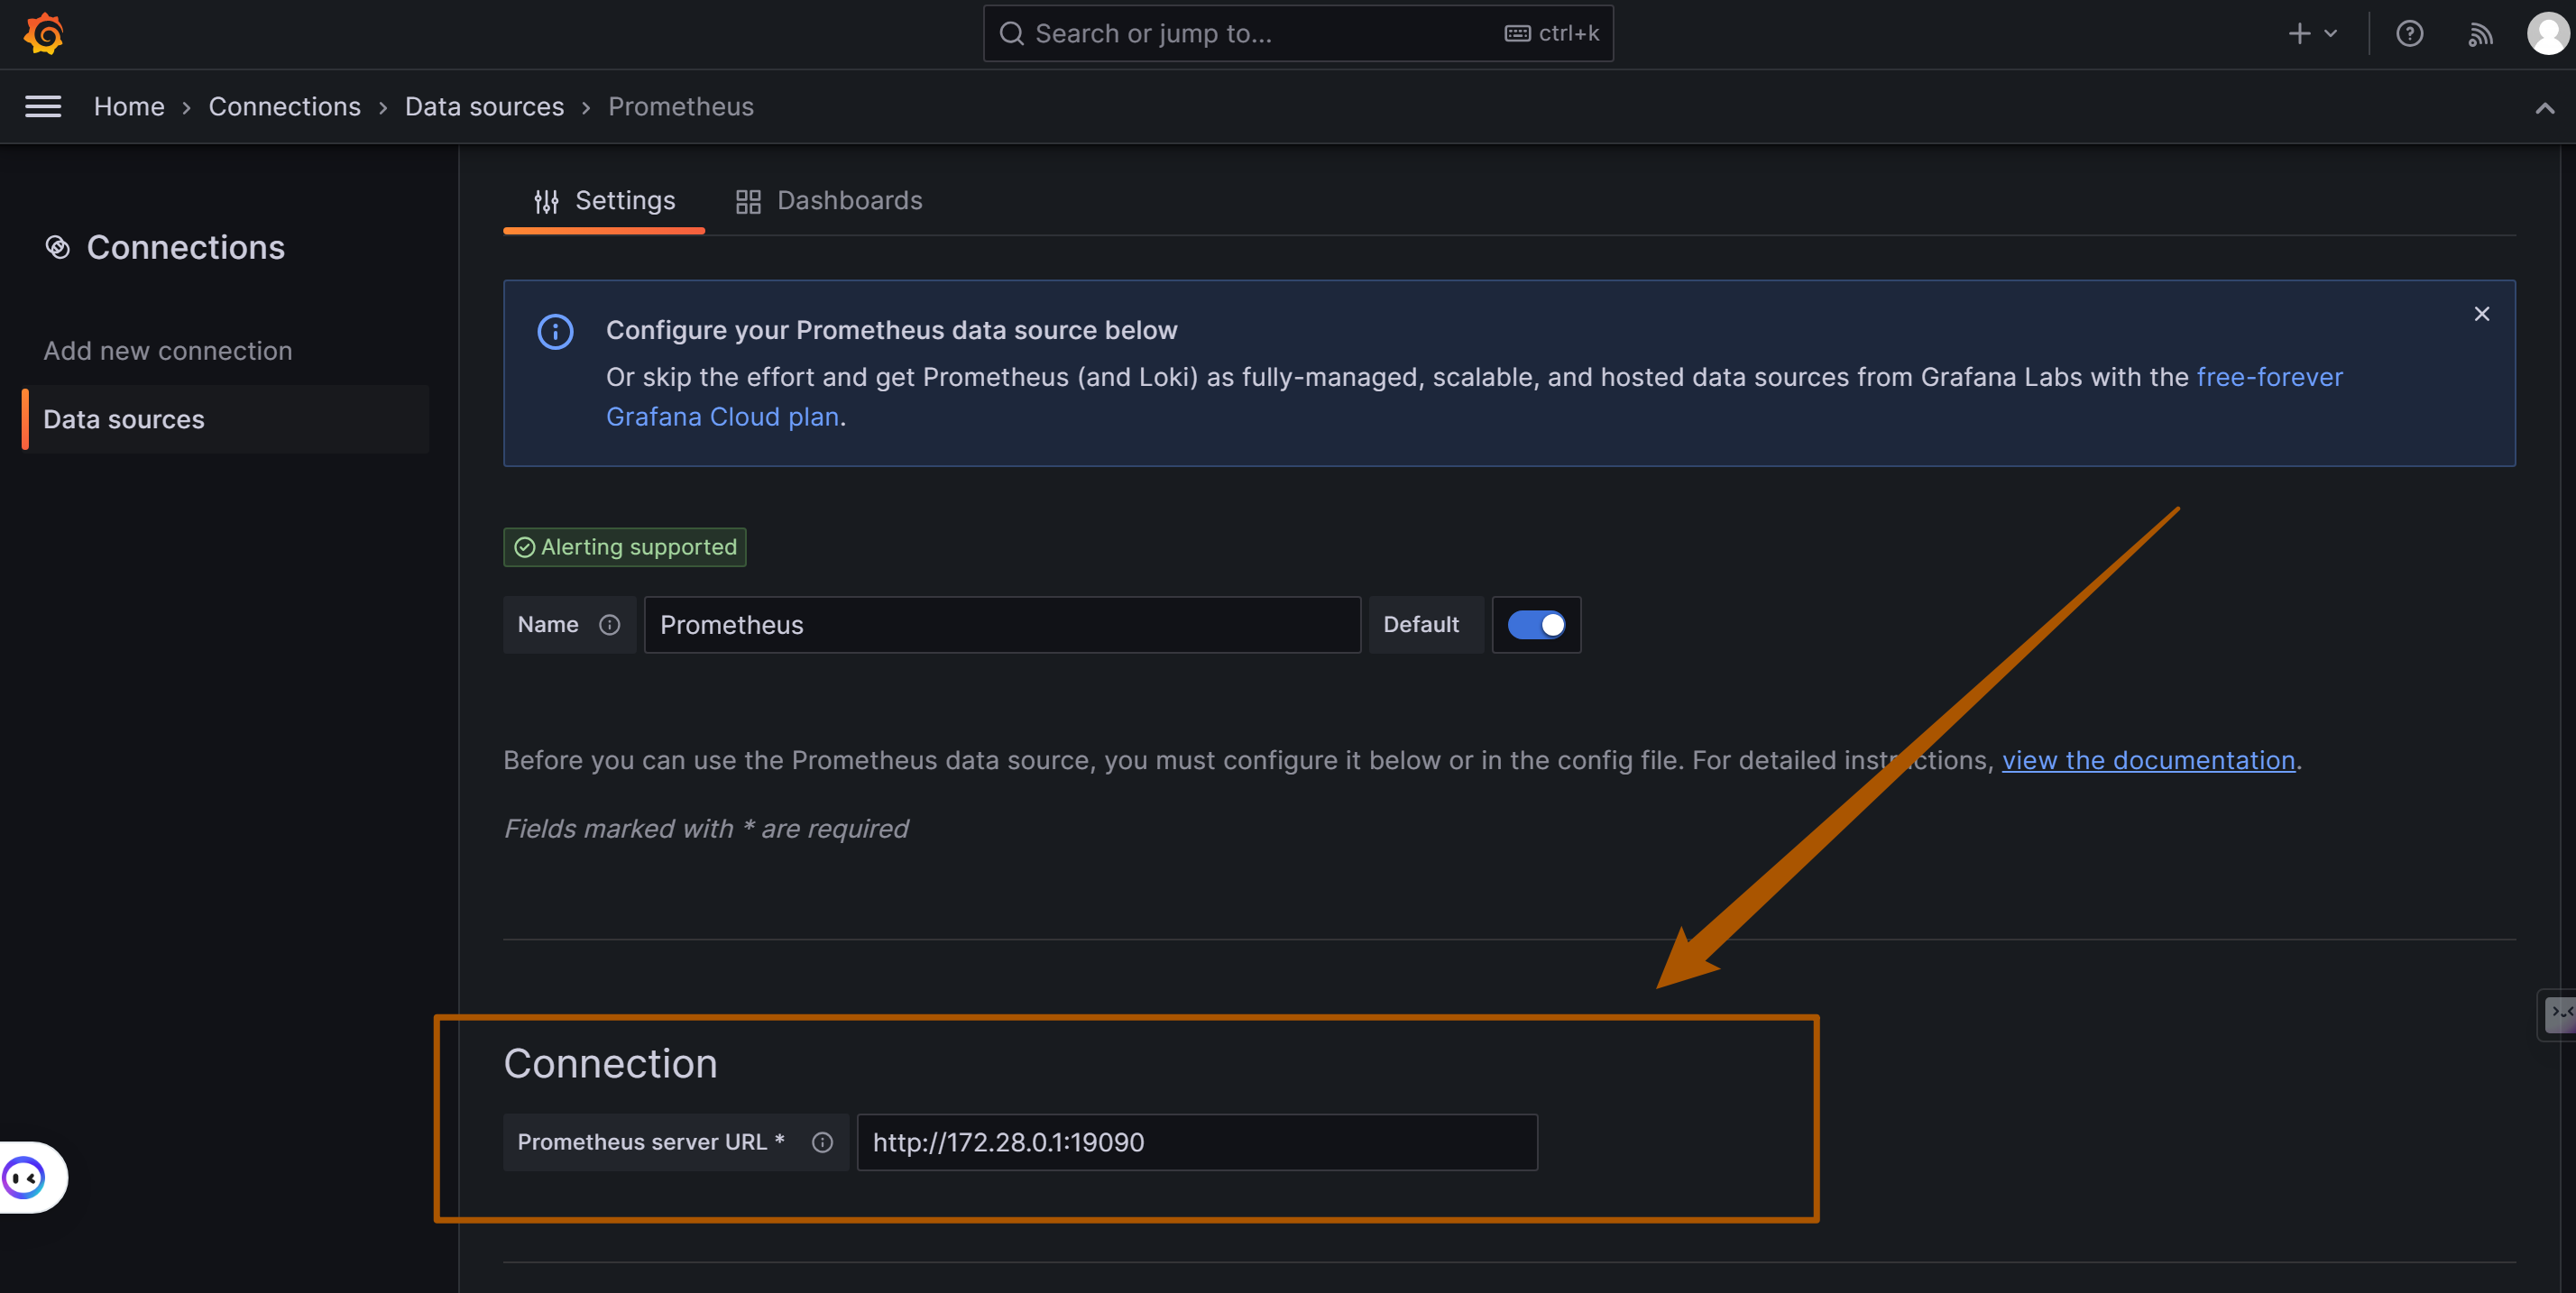
添加Prometheus数据源
如下图,在左侧菜单栏找到Connections/Add new connection,在输入框内输入prometheus添加数据源,并输入Prometheus数据源的URL: http://your_ip:19090 (19090为Prometheus默认端口) ,点击"Save and Test"保存.
导入dashboard
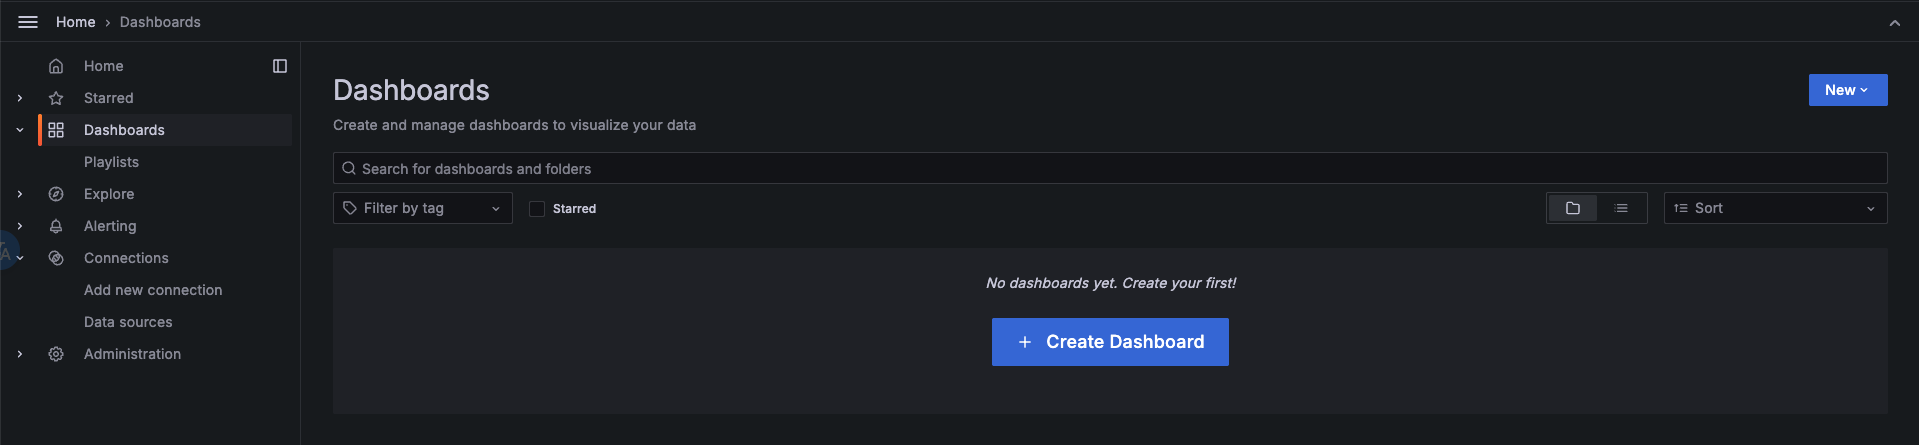
在左侧菜单栏选择Dashboards,点击Create Dashboard按钮,再点击Import dashboard导入仪表盘。
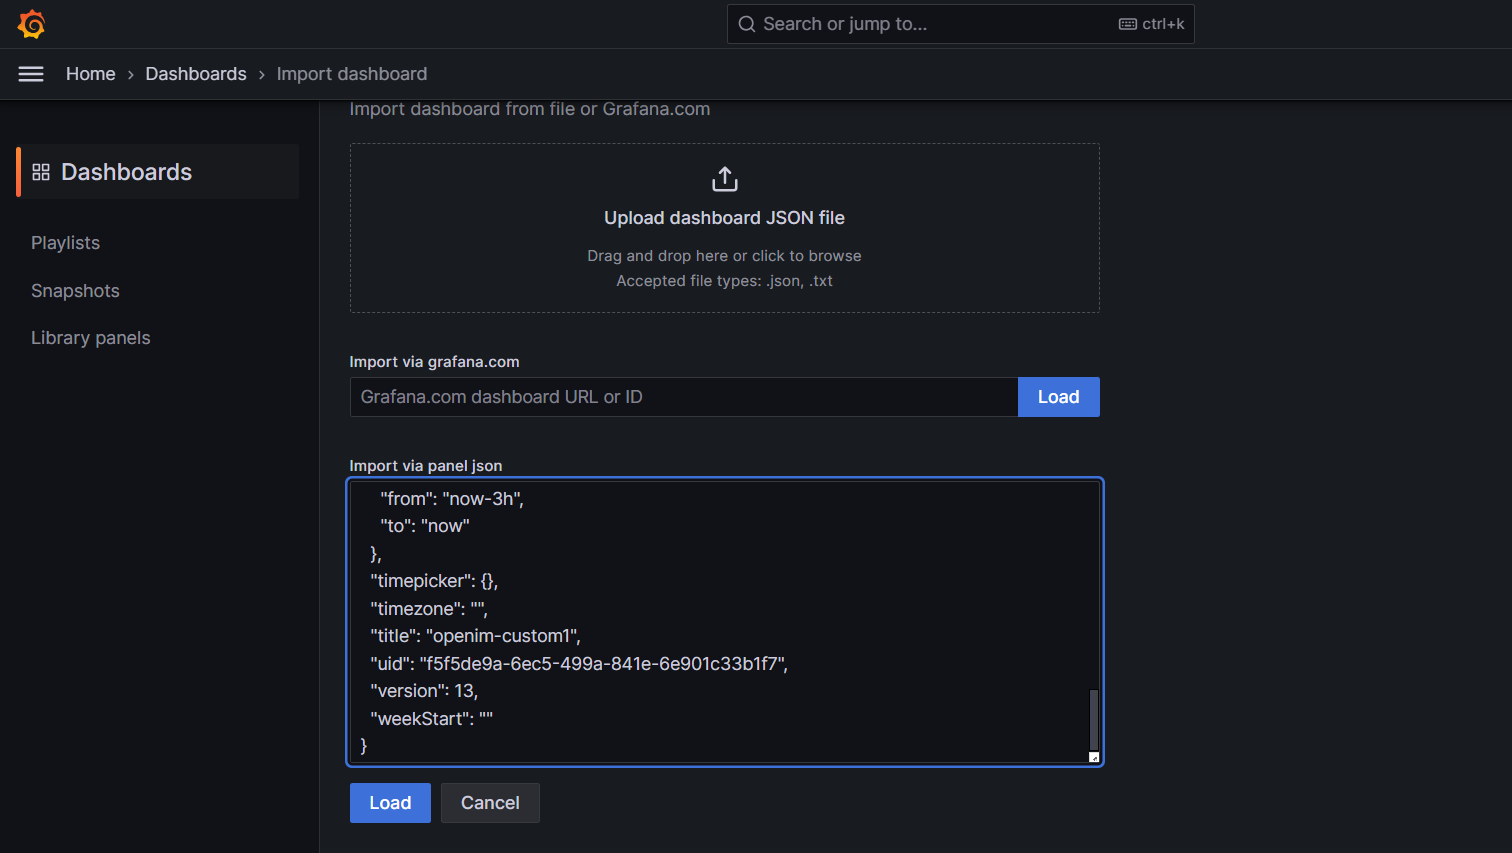
有两种方式导入OpenIM默认的仪表盘:
- 拷贝 https://github.com/openimsdk/open-im-server/tree/main/config/grafana-template/Demo.json 内容到
Import via dashboard JSON model区域。 - 点击
Upload dashboard JSON file,上传open-im-server/config/grafana-template/Demo.json文件。
接着点击load按钮
选择刚刚添加的 Data Source,再点击Import 即可导入指标信息,如下图
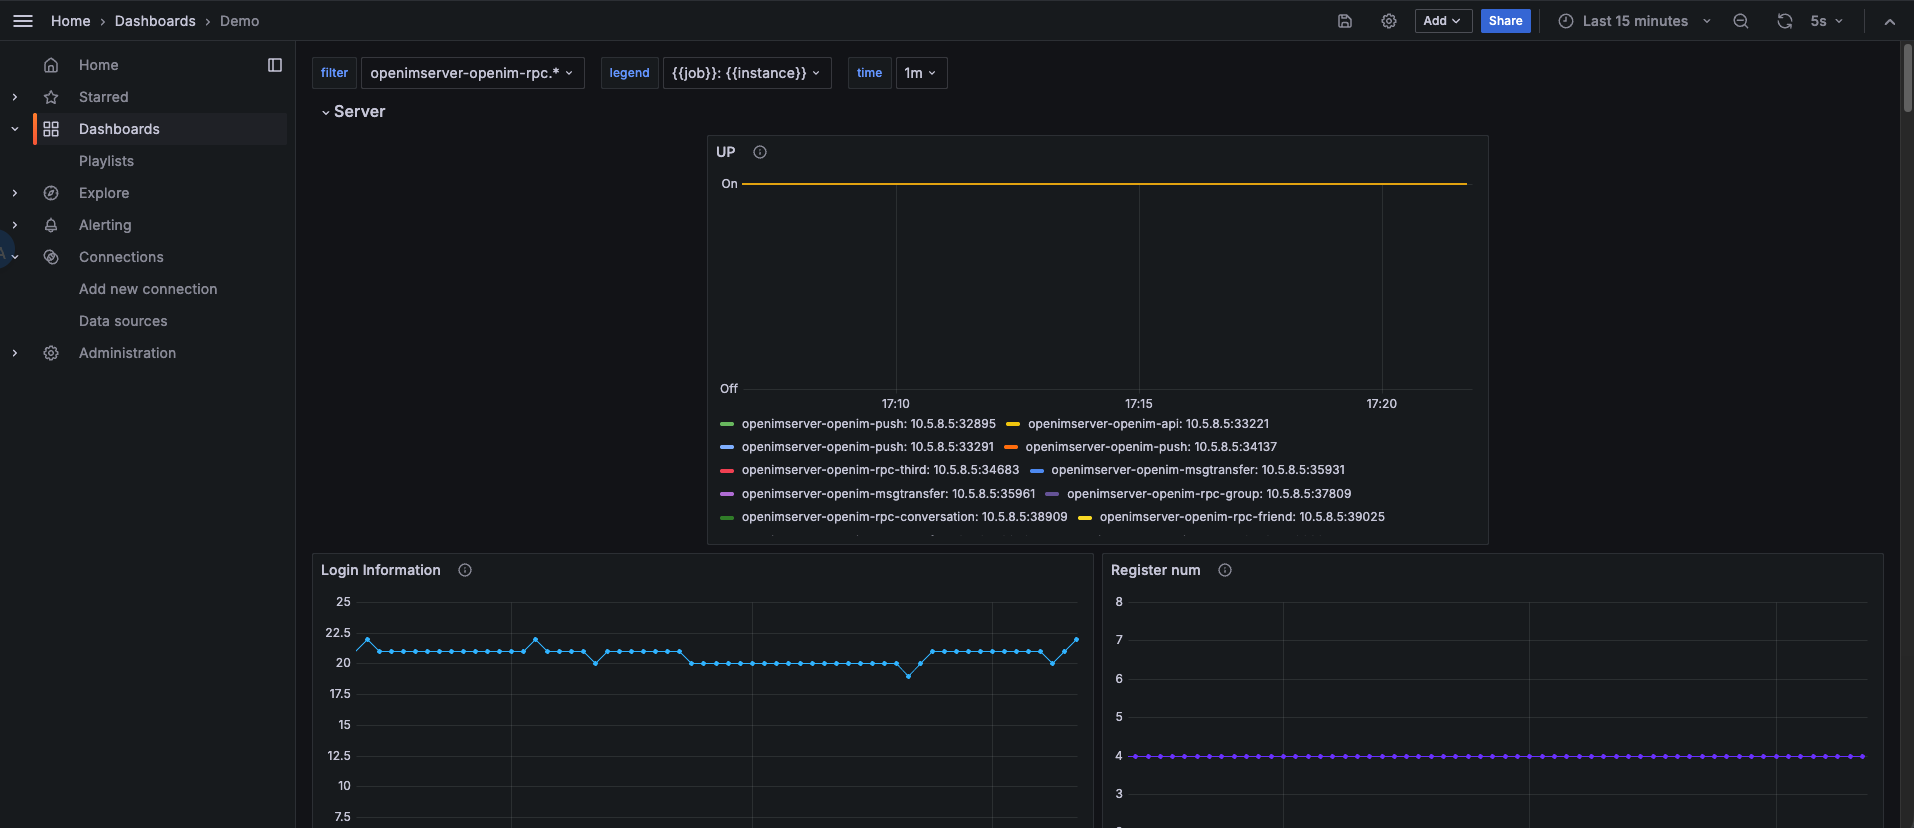
至此,OpenIM的主要监控指标配置完毕。
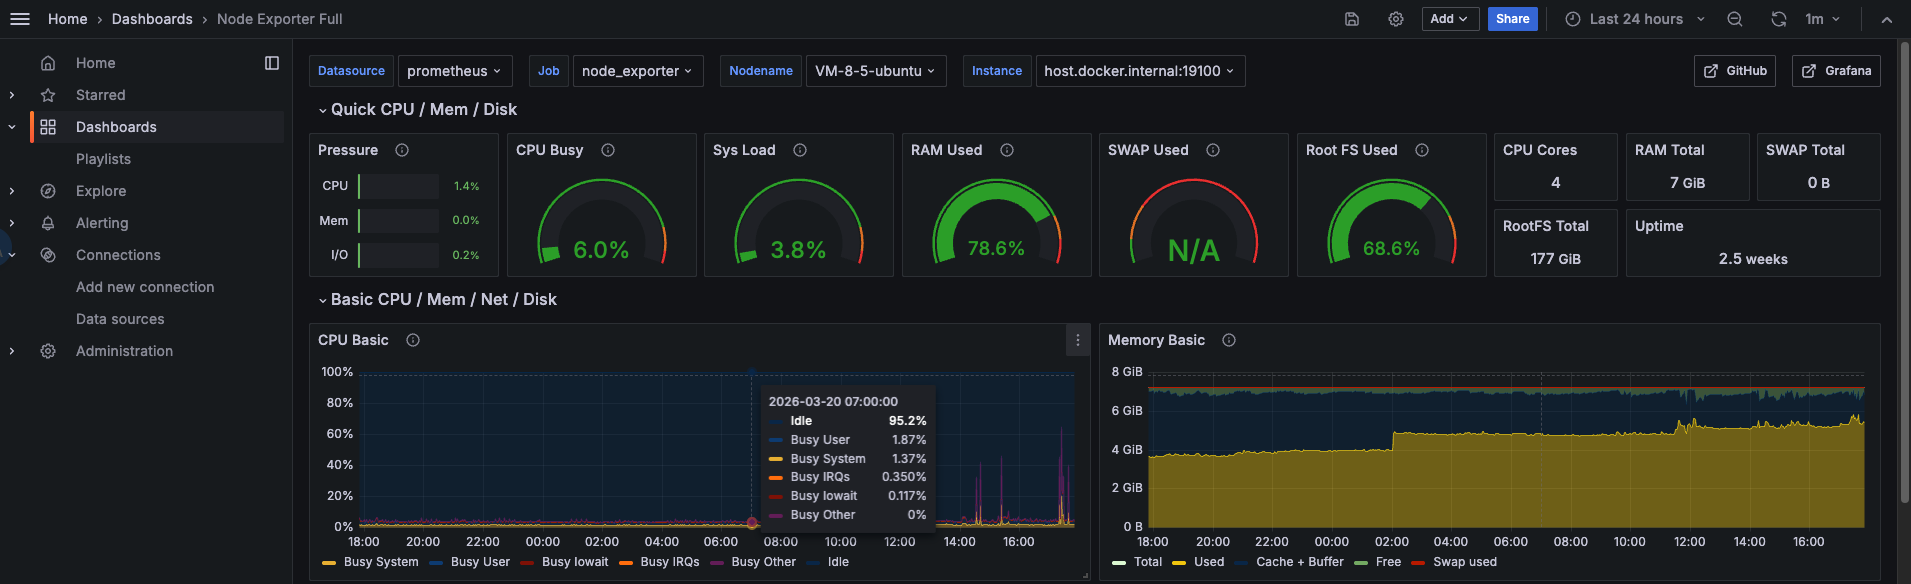
3.Grafana导入node exporter指标数据
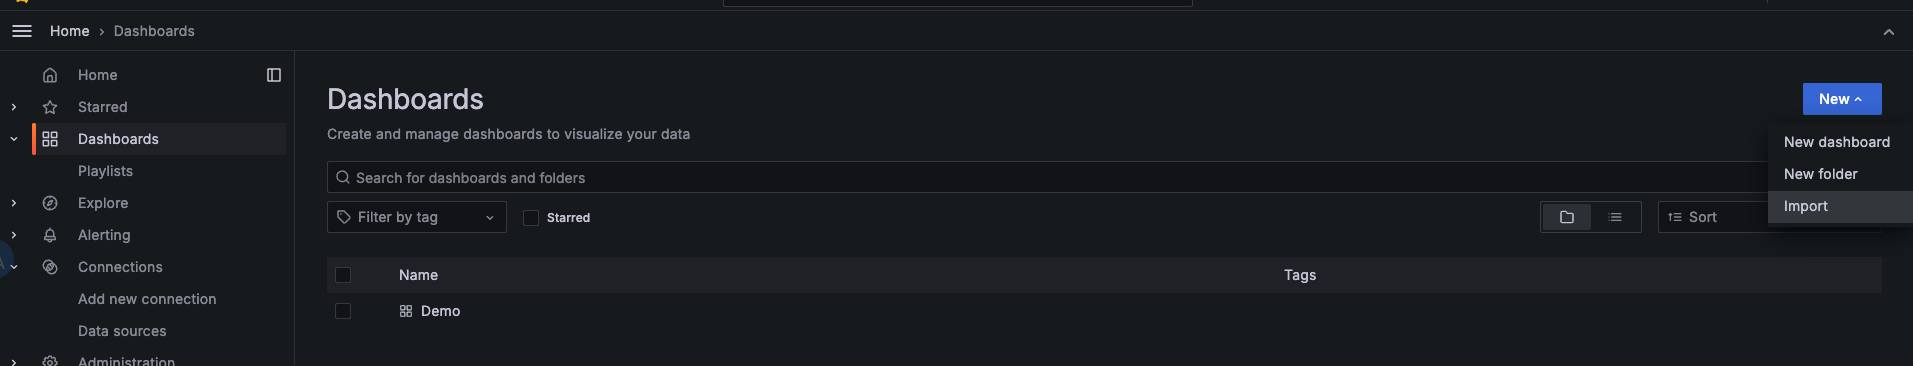
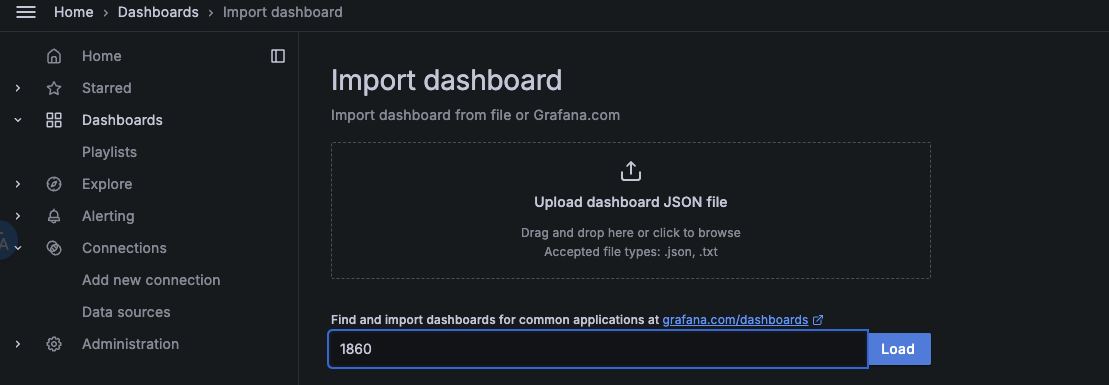
点击左侧菜单栏的Dashboard,选择右侧New下拉框中的Import。
在Grafana.com dashboard URL or ID输入框中填入1860,点击右边的Load,再点击Import。
node-exporter指标信息,如下图